

Daily Market Update 14th September 2016
ECONOMIC DATA OF THE DAY
| Time | CY | Indicator | Forecast | Actual | Previous |
|---|---|---|---|---|---|
| 12:30 | JN | Industrial Production MoM | n/a | n/a | 0.00% |
| 12:30 | JN | Industrial Production YoY | n/a | n/a | -3.80% |
| 14:45 | FR | CPI YoY | 0.20% | n/a | 0.20% |
| 14:45 | FR | CPI MoM | 0.30% | n/a | 0.30% |
| 16.30 | UK | Jobless Claims Change | 1.8k | n/a | -8.6k |
SPEECHES
- 14:45 – AUD: RBA's Richards Speech on Gold Coast
- 17:50 – AUD: RBA's Debelle Speech in London
OVERNIGHT NEWS
- OIL:
- The international Energy Agency changed its view on global oversupply, seeing a glut persisting into 2017. The EIA is forecasting a demand of 1.3 mio Barrels / day down from 1.4 Mio and 1.2 Mio Barrels / day in 2017: "Recent pillars of demand growth - China and India - are wobbling," “As a result, supply will continue to outpace demand at least through the first half of next year,” the IEA said. “As for the market’s return to balance - it looks like we may have to wait a while longer.”
- US:
- The Budget Deficit expanded to $107.1 Bn (Exp. $108 Bn) due to weak revenue growth and a steady increase in government spending.
- BOJ:
- Nikkei reported that the Bank of Japan could move interest rates further into negative territory
FOREIGN EXCHANGE (INDICATIVE RATES)
| Currency | Last | % Change | Overnight Range |
|---|---|---|---|
| DXY | 95.63 | 0.57% | 95.08 – 95.67 |
| EURUSD | 1.1219 | -0.13% | 1.12 – 1.13 |
| USDJPY | 102.45 | 0.70% | 101.42 - 102.75 |
| AUDUSD | 0.7470 | -1.35% | 0.74 – 0.76 |
| GBPUSD | 1.3195 | -1.08% | 1.32 - 1.33 |
COMMODITIES (INDICATIVE RATES)
| Currency | Price USD | % Change | Overnight Range |
|---|---|---|---|
| Gold | 1319.05 | -0.66% | 1315.76 - 1332.15 |
| Silver | 18.87 | -1.27% | 18.79 - 19.29 |
| Oil (BRENT) | 47.10 | -2.52% | 46.96 - 48.22 |
| Oil (WTI) | 44.90 | -3.00% | 44.77 - 46.13 |
COMMODITIES
Precious Metals: Gold had its fifth straight falling session, with dollar still stealing the thunder, even though dovish Fed comments are supposed to support the precious in the short term. Gold Dec has touched 1320 and bounced back, with technical pressures overwhelming. Further short term decline is expected while 100d MA @ 1310 level is a key support.
Oil: Oil tumbled again overnight amid IEA reported accelerated slowing of global oil demand, and inventories rising to a record of over 3.1bln barrels. Near month contract broke through 45 and bounced back a bit above the level. It is expected that the 45 level will be penetrated again and a new price corridor of 40-45 will be formed.
FOREX NEWS
- Global risk-off which started with the Asia currencies continued overnight following the EIA report on oil and pushing the USD much higher against all the currencies. DXY rallied 0.57% on its way to the next resistance at the 200d MA (96.108).
- Commodities currencies dropped following the USD rally and the drop in metals. AUD dropped 3 big figure in the span of 4 days to trade close to the support at the 200d MA. AUDJPY is very close to the support of 75 after failing to break the 100d MA at the beginning of the month. NZDUSD is following the rest of the market after 1.5 month of rally to drop to the support at 0.7200. The other watched pair AUDNZD continues to test new lows on stops after breaking the 1.0400 support at the start of the month.
- UK inflation came in weaker than expected at 0.6% YoY and 0.3% MoM (Exp. 1.4% and 0.4%) pushing GBP 1% lower to 1.3200. However, we still trade in the same wide range of 1.30/1.35.
- In Emerging Markets, USDKRW had a strong rally ahead of the 3-day holiday literally exploding the past 4 sessions from 1092 to 1128 at the close of NY. The rest of the EM currencies had similar moves with USDBRL up 2%, USDSGD long positions finally performing and the pair is trading closer to the 200d MA at 1.3744.
Traders Bemoaning Lack of Shock, Awe in Markets Finally Get Some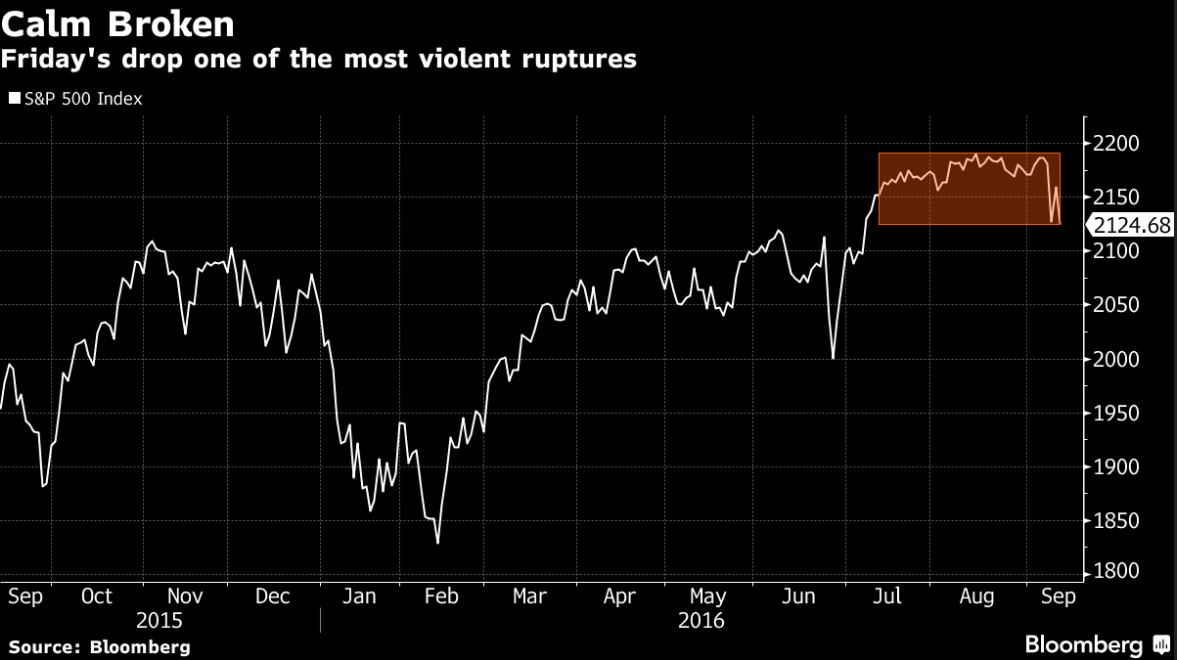
Traders who complained all summer about markets stuck in a zombie state are getting what they wanted, and probably will be for a while.
Eruptions of volatility this big rarely go away quickly. By one measure, the selloff ripping equities represents the sixth most violent rupture to market calm in history, with the S&P 500 Index’s drop of 2.5 percent exceeding its daily move in the prior month by a factor of 10. Every time that happened in the past, turbulence took its time petering out
Patterns like that may affirm the view of bears who spent July and August warning that the peace blanketing everything from equities to bonds and currencies was likely to end in a bang, not a whimper. Of particular concern right now is the concerted nature of the selloff in which markets that don’t ordinarily move in the same direction suddenly are.
“When investors come back from the beach and start thinking about, ‘How am I going to prepare for the fourth quarter?’ we’re going to see a lot of activity,” said Brad McMillan, chief investment officer of Commonwealth Financial Network in Waltham, Massachusetts, which oversees $100 billion. “Volatility doesn’t go away. It gets stored up.”
Stocks and bonds plunged in tandem for the second time since Friday, driving measures of volatility higher as investors lost confidence central banks still have ammunition to promote growth. U.S. stocks notched their third straight move of at least 1 percent after 43 days without one, while Treasury yields were jolted out of the tightest monthly range in a decade. Oil joined the selloff, punishing currencies of resource exporters and leaving investors with few places to hide.
Read More at bloomberg.com

